
flyingturducken
-
Posts
15 -
Joined
-
Last visited
flyingturducken's Achievements
2
Reputation
-
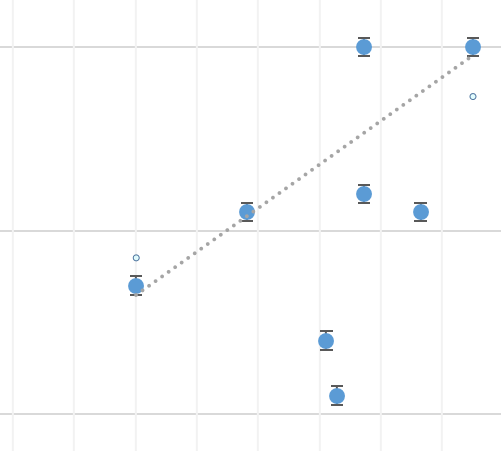
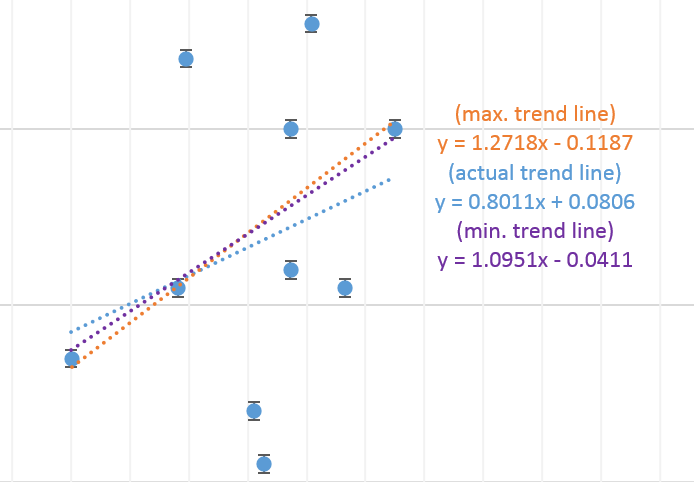
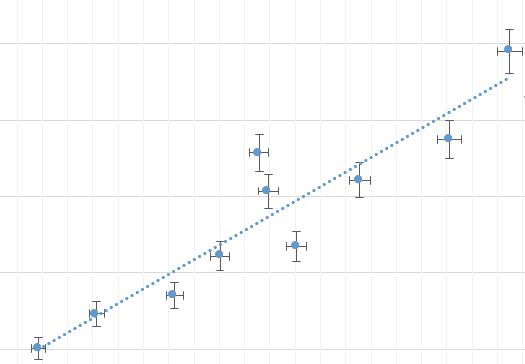
Hi all, I'm having some difficulties over the maximum/minimum trend lines for my graph. Here is the original one with the line of best fit added: And this is after I added the maximum/minimum lines: Now the problem comes in the minimum line, because it goes above the original trend line. The only way I can solve this is if I discount the upper and lowermost point, but they're not really anomalous as the final calculations graph looks like this: If it helps, this IA is about circular motion: the first 2 charts are for the relationship between radius(y) and period(x), and the last chart shows the relationship between centripetal force(y) and velocity(x). Thanks in advance.